Synopsis Heatmaps show how real users interact with your site by showing where they click, how they scroll, and which areas they miss. It turns user behaviour into easy-to-understand visuals, helping you spot problems with the UI & UX. Heatmaps show patterns of what users engage with and what they don’t, which isn’t always clear from traditional analytics tools. This helps you make decisions leading to better website layout, content placement, and overall user experience.
What is a Website Heatmap?
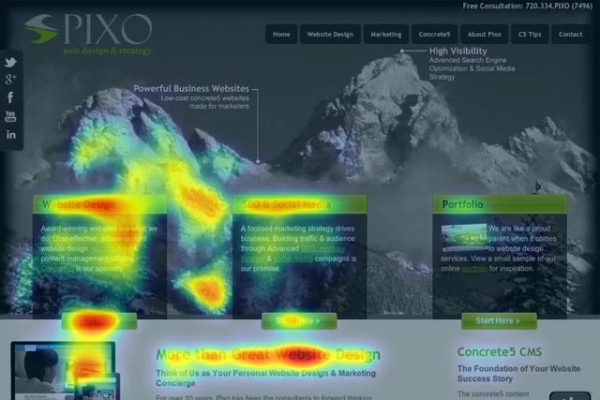
Website Heatmap is a graphical representation of data, which is depicted in various colours. It uses colours to show the user behaviour visually. Warm colours like red and orange highlight areas where users are most active, while cool colours like blue and green show parts of the page that aren’t getting much attention. Special scripts track every click, scroll, and hover action, and turn that into a clear picture that’s easy to understand, and is ideal for website optimization. For example, a heatmap might show that people spend more time looking at an image than they do on your main button, or that most visitors don’t scroll down far enough to see important information.
Source: vwo.com
How Heatmap Works?
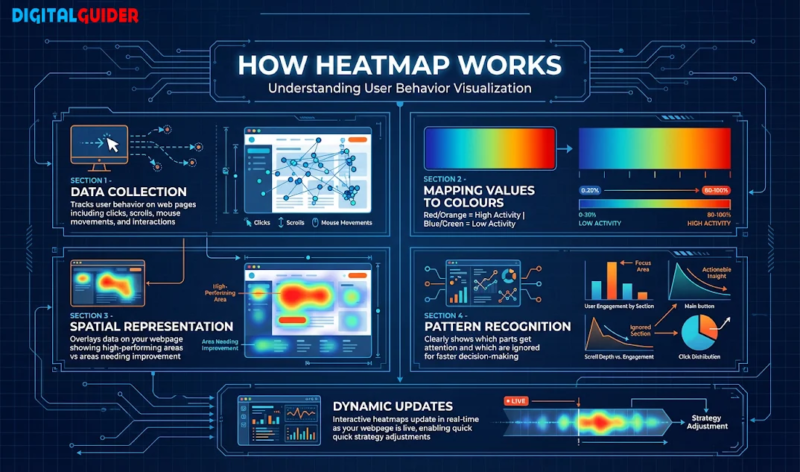
Heatmap works by keeping track of how people interact and then turning that into images:
Data Collection:
Heatmap collects information about the user behaviour on a web page. It will track and analyse your work in things like clicks, scrolls, mouse movements, etc.
Mapping Values to Colours:
After collecting the data, it depicts these actions with a colour. It maps the data with different colour tones, bright colours like red and orange for high activity, while cooler colours like blue and green are for lower activity.
Spatial Representation:
Heatmap overlays the area of your study. While examining a website, it will map its findings over your webpage and show the areas that worked well and the areas that need improvement.
Pattern Recognition:
The best part of a heatmap is how clearly they show patterns. You can see at a glance which parts are getting attention and which are being ignored, which helps you make decisions faster.
Dynamic Updates:
Many heatmaps are interactive and update in real time as your webpage is live. This means you can watch things happen as they happen and change your plans quickly if needed.
Types of Website Heatmaps
Many types of heatmaps will help your website to work more efficiently:
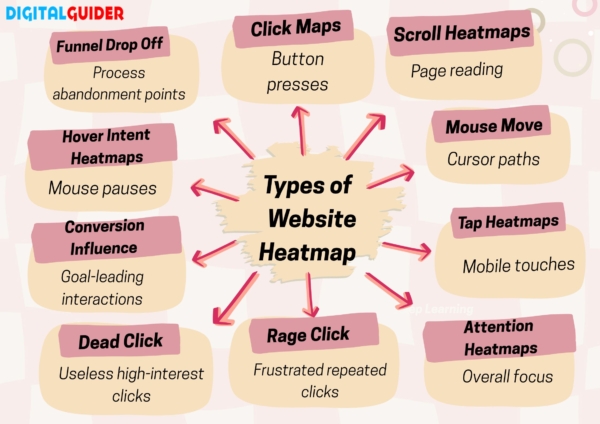
Click Maps:
This type of heatmap will show you how many users have clicked on your website with their mouse, whether they clicked any link, navigation, or a simple CTA. This variation will help you examine your website and easily analyse the work area of what your viewers are ignoring.
Scroll Heatmaps:
This type will analyse the whole website visit to show you how far down a page a user scrolls before leaving. This will track the overall page reading performance.
Mouse Move Heatmaps:
This type of heatmap will examine the movement of the mouse of users. It will be easy for you to understand where your user is looking the most while scrolling through the page. This will tell you which content is getting the most attention and which is ignored.
Tap Heatmaps:
This type of heatmap is beneficial for a mobile-friendly webpage. This will track the mobile touches, where the user tapped the most and where they lacked.
Attention Heatmaps:
These heatmaps are often used to look at the activity of users. You will get the insights into how users look at a webpage, an ad or just the design. It focuses on the key attentive look by an user.
Rage Click Heatmaps:
These heatmaps are used by marketers to understand the areas that may have frustrated the users. It shows you the areas where the visitors have continuously clicked and may be interrupted from understanding the call to action clearly.
Dead Click Heatmaps:
This type of heatmap will tell you the areas where users interacted the most, but it is of no use. People are showing interest in a particular area, but there is no action. These areas can be turned into effective calls to action or lead generation tools.
Conversion Influence Heatmaps:
This type of heatmap shows which part of the website helps users take action, like making a purchase or signing up. It does not just show where people click and scroll, but it tracks interactions that lead to conversions. They tell you which button, links images, or content people are actually engaging with to complete your goals, and which part can be modified to derive results.
Hover Intent Heatmaps:
These heatmaps show the areas where visitors stopped their mouse while scrolling, which will indicate the areas that may have interested the users or confused them. This helps you to adjust your content & write the information more clearly.
Funnel Drop Off Heatmaps:
These heatmaps show you where the user has stopped scrolling. Where they stopped while signing up, filling a form, in between a purchase, etc. This helps you understand the problem and modify those steps to make it more user-friendly.
| Type | What It Tracks | Best For |
| Click | Button presses | Fix bad links |
| Scroll | Page reading | Shorten long text |
| Mouse Move | Cursor paths | Better layouts |
| Tap | Mobile touches | Phone-friendly design |
| Attention | Overall focus | Homepage tweaks |
| Rage Click | Frustrated repeated clicks | Clear CTAs |
| Dead Click | Useless high-interest clicks | Add actions |
| Conversion Influence | Goal-leading interactions | Optimize conversions |
| Hover Intent | Mouse pauses | Refine content |
| Funnel Drop Off | Process abandonment points | Smooth user flows |
How to Install and Use a Heatmap
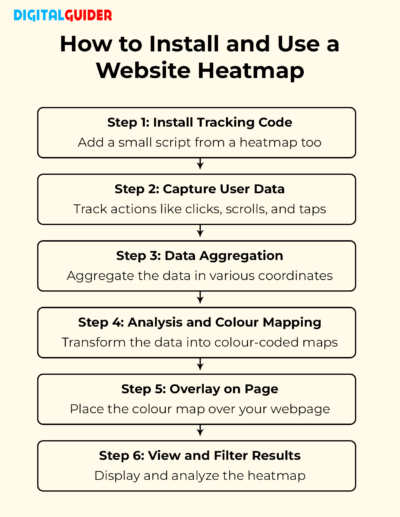
- Step1: Install tracking code- To install the heatmap for your website, add a small script from any of the heatmap tools. This code is essential for the easy tracking of daily visitors’ activity.
- Step2: Capture User Data- Once you are done installing the tracking code, it will start capturing the actions of your visitors. Actions like clicks, scrolls, mouse hovers, taps on mobile, and more.
- Step3: Data Aggregation- This tool will start aggregating the data in various coordinates (X, Y) and help you analyse the goods and bads of your website’s conversion.
- Step4: Analysis and Colour Mapping- This tool will now start merging the activities and sort the data accordingly. As it is a colour coding system:
- Red Colour indicates high activities, such as a high number of scrolls, visits, or taps.
- The cool tones, like green to blue, will indicate the low active areas, such as fewer scrolls, fewer visits, or no-tap areas.
- Step5: Overlay on Page- Now, to make it easier for you, this tool will overlay on your webpage and place this colour map right over an image of your actual webpage.
- Step6: View and Filter Results- Now, check the colour map and put up the live status on the tracker, as users are continuously visiting your website to get the fresh insights.
How to Install and Use a Heatmap
How to Use Heatmaps for SEO
- Identify high-traffic pages
Firstly, find the pages that get the highest traffic and visits. Cluster them to make the best use of heatmaps. - Link With Other Tools
Use heatmaps along with other tools like session recordings or analytics to understand why users act the way they do. - Analyse scroll depth
Secondly, analyse the scroll depth. Identify where users stop scrolling and whether there is important content that can be placed higher if needed. - Optimise CTA & internal links
See where users click the most; identify the place where users have clicked the most, and ensure to put CTA buttons there. Provide internal links in visible and highly active areas. - Fix UX blockers
Look for things that confuse or annoy users. If there are too many popups, hard-to-click buttons, fix this to let your page run smoothly. - Split Data As Per Device Type
Split your data into groups based on things like device type (mobile or desktop) or user type to get more focused insights. - Re-test after changes
After making updates, check the heatmaps again. Check if the users’ scroll has increased, and see if clicks are improved.
Why Are Website Heatmaps Important for SEO?
Heatmap provides visual, data-driven insights into user behaviour, showing you exactly what your users are doing while visiting your website. It will also help you with a website audit to know what structure & design can be changed according to the user’s intent.
Key Importance of Heatmaps:
- Uncover Hidden Friction: By using heatmaps, you can easily identify areas of work where your visitors are stuck, pinpoint non-clickable elements, and areas that receive unnecessary clicks.
- Optimise Content Placement: The best use of heatmaps is for content optimization. As they analyse the most clickable/readable content and what is being ignored, you can easily optimise the text as per the user intent. Heatmaps will tell the wrong placements of your content & CTAs.
- Data-Driven Design: Move from gut feelings to informed decisions by seeing real user interactions, making design changes that directly link with user behaviour.
- Identify distractions: Heatmaps will help you identify which sessions are irrelevant and are gathering unnecessary attention. This will boost the optimisation and will make your content more relevant as per the reader’s intent. This optimisation will help increase the engagement on your website and ease the effort of removing the unwanted content.
- Device-specific insights: This is also an important element for website optimisation. As heatmaps will make it easier for you to identify on which device your website is performing the best. It will tell you if the mobile version is better or the desktop version.
- Boost Conversions: Heatmaps will identify the better placements of CTA and help increase engagement on your webpage.
- Reduce pogo-sticking: Pogo-sticking is something that occurs when a user clicks a result in a search engine and is taken to the result page, but clicks a different result. Here, a heatmap helps you to identify the user intent, and you can locate rage clicks and fix dead zones.
- Support Core Web Vitals Optimisation: These are user-centric metrics for loading, interactivity, and visual stability. Heatmap helps you to optimise the areas where users engage and interact.
How Heatmaps Improve CRO and UX
Heatmaps are very important for conversion rate optimisation (CRO), which is the process of making more website visitors take the actions you want them to, like buying something or filling out a form. These maps show where users are looking and clicking using colours; red means people are paying a lot of attention, and blue means they’re not. Tools like Hotjar, Crazy Egg, and Microsoft Clarity create these maps by collecting data on clicks, mouse movements, how far people scroll, and even recordings of their sessions. You will get to know the areas to improve for a better user experience and audit your page accordingly.
For example, let’s say you launch a new online store page.
The stats say 60% of visitors leave without doing anything. Why? A click heatmap shows people tapping on a button that doesn’t work, thinking it’s “Buy Now.” A scroll heatmap could show that the important content is too far down the page and isn’t seen at all. These findings uncover problems like confusing menus, slow images, or websites that don’t work well on phones, issues that just looking at numbers can miss.
Heatmaps vs Google Analytics
Website heatmap google analytics are highly used to optimise a website. Their working focus and use differ as per their process.
Heatmaps are tools that are based on a qualitative description of your website in terms of clicks, scrolls, hovers, moves, and more. They visually diagnose your website and give a visual representation of all the highly active areas and low active areas as per the visits on your site.
Google Analytics, on the other hand, focuses more on the quantitative approach to the problems of the website. It gives you the numerical data of who, where, and how the user arrives. It does not provide you with visuals to monitor the working of your website.
| Category | Heatmaps | Google Analytics |
| Focus | Qualitative: clicks, scrolls, hovers, moves | Quantitative: traffic, conversions, funnels |
| Strengths | Visual diagnosis, no setup for behaviour data | Free, macro-level insights, demographics |
| Weaknesses | Costly at scale, less numerical, accuracy varies | No visuals, needs event config, misses non-clicks |
| Aspect | Heatmap Tools (Hotjar, Crazy Egg, Clarity) | Google Analytics (GA) |
| Best Use | Diagnose issues (e.g., ignored CTAs) | Identify problems (e.g., high exits) |
Can Google Analytics Replace Heatmaps?
No, Google Analytics cannot replace the heatmaps, as both of these tools have different approaches towards website optimisation. Google Analytics works on a quantitative approach, while heatmaps focus on the visuals and a qualitative approach. None of these tools can replace the others, but they can be combined for better and faster optimization. Firstly, analyse the numbers impacting your website and then move on to the visuals to understand the behaviour of your visitors.
Role of AI in Heatmaps for Website
AI enhances websites by analysing the behaviour patterns of the visitors very quickly. By using the best of prompts, you can ease the analysis and may save time to help you with improving your user-friendly website structure. AI also helps to predict the future behaviour of the users and is quick in spotting issues humans might miss.
The benefits of using AI for website heatmaps will:
- Save time: With the best use of AI, you can save ample time for analysing your website and with its best suggestions, you can easily know the areas of improvement. It will automatically predict the latest trends and suggest the changes accordingly. You won’t be wasting much time researching and analysing.
- Raw Data into Strategy: When you use AI for website heatmap analyses, it will easily turn your raw screenshots into actionable strategies. They not only suggest the problem, but also provide you with the best solutions and techniques to improve the website.
- Understanding Visitors: AI will understand the pattern of visitors, what they are interested in, and what exactly frustrates them. You just need to provide a screenshot of the heatmaps for the website, and it will tell you the exact pattern of your visitors by understanding their moves, scrolls, clicks, and more.
What to do when using AI for heatmaps:
Upload a page screenshot or integrate tracking code; AI processes data to generate overlays and insights without manual review. Tools like predictive models simulate real user gazes for pre-launch testing. No coding needed for basics; results appear instantly for UX tweaks.
Common Heatmap Mistakes to Avoid
Using Heatmaps will definitely provide you with the best insights into your website, but their proper use is still very important. Here are some common heatmap mistakes that one must avoid:
- Do not rely on a small sample size:
While using heatmaps, do not just rely on small sample sizes, as they would not be enough for analysing the issues for your website. Do not jump to conclusions with a small sample size. - No context for ‘why.’:
Heatmaps only tell you the ‘what’ of the problem/ issue of your website. Do not rely on the results; try to find the reason for the problem. It does not provide you with the ‘why’ of the issue. - Misunderstanding ‘Hot’ zones:
As you know, the ‘hot’ zones of a heatmap show you the highly active areas of your website, but do not misunderstand them. Sometimes the ‘hot zones’ can show the hyperactive areas, which unnecessarily draws the attention of the visitors. This issue must be examined carefully, and only the necessary content must be the focus of the ‘hot zone’. - Too much dependency on colours:
When you open the heatmap of your website, you must understand the importance of some specific colours. You will see many colours on that map, which must be ignored, and the only focus must be drawn towards the reds and blues. Try identifying the issues and not the colours. - Forget dynamic content:
While using heatmaps for website optimisation, you must be very careful that it tracks the dynamic content. It should catch the tracking of all the drop-offs, pop-ups, & related dynamic content. Check for the colour coordinates for them as well to avoid unwanted attention.
Who Should Use Website Heatmaps?
- SEO agencies:
SEO agencies use heatmaps to look at how users interact with a website, beyond just rankings and traffic. These heatmaps show if visitors are clicking on important parts of the page, spending time on content, or leaving before seeing much. This helps SEO experts improve page design, link structure, and improve the content placement to make visitors stay longer and take action. - Digital Marketing Agencies:
For digital marketing agencies, heat mapping is a simple way to check how well their marketing campaigns are working. Using heat maps, agencies can see which parts of a landing page, call-to-action buttons work best, and where people get stuck while browsing. - E-commerce Stores:
Heatmap helps e-commerce websites to get useful insights about their product pages. They can easily check if their page is best optimised, clicking on the users, and if the checkout process is working well. Heatmap shows them how far their users scroll and what causes them to leave their shopping cart. They can easily find a better placement for their ‘buy now’ buttons and other CTA’s. - SaaS Websites:
SaaS companies use heat mapping to understand how visitors interact with their website, especially on pages like pricing, onboarding, and features. Heat maps help these companies find ways to improve free trial sign-ups, understand which features are most important for new users, and make the overall user experience better. - Locally Owned Businesses:
Local businesses use heat mapping to make their contact forms easier to use, improve the effectiveness of action buttons on their site, and clearly show their location on web pages.
Best Heatmap Website Tool in 2026
Many tools can help you with your website optimization:
| Tool | Heatmap Types | Best For | Pricing (Monthly, as of 2026) |
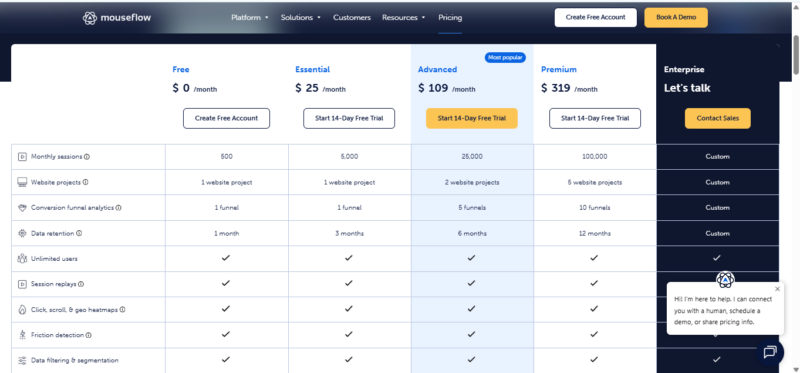
| Mouseflow | Click, scroll, movement, attention, live, geo | Overall analysis | Free Trial- $25 – $319 |
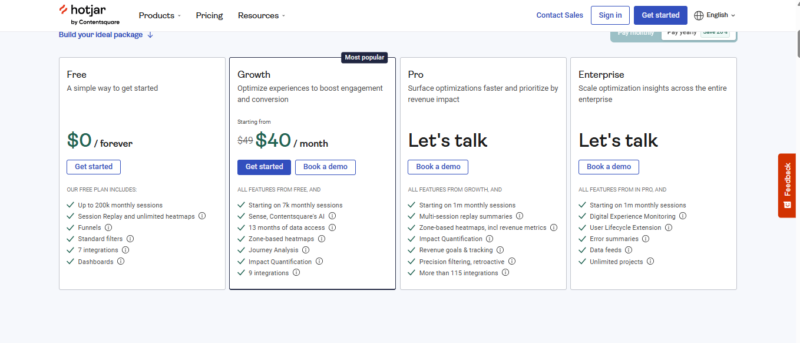
| Hotjar | Click, scroll, move, attention | UX design, feedback | Free Trial- $40 |
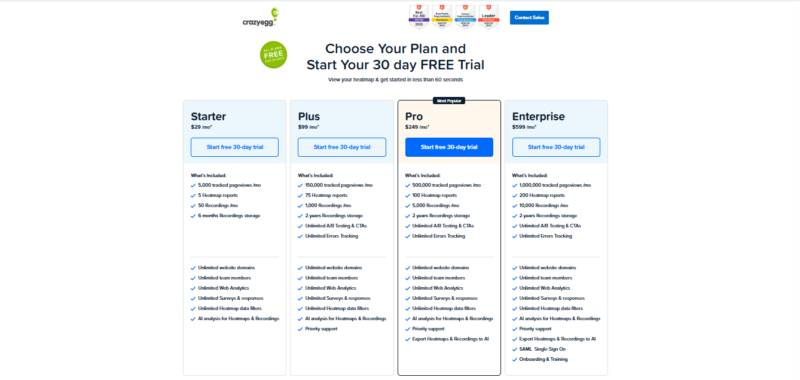
| Crazy Egg | Click, scroll (via Snapshots) | Beginners | Free Trial- $29 – $599 |
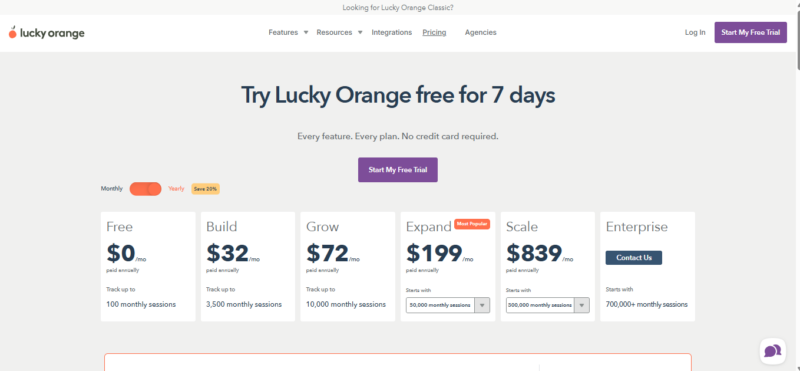
| Lucky Orange | Dynamic, real-time | Real-time tracking | Free Trial- $32 – $839 |
| Microsoft Clarity | Click, scroll, rage | Budget users | Free Forever |
An advanced platform that provides heatmaps showing where users click (on buttons or links), how far they scroll down pages, how their mouse moves (like the F-shaped reading pattern), how much time they spend on elements, live views of real-time sessions, and maps showing where visitors are from (like US states).
It’s great for in-depth analysis in competitive US markets and can handle large amounts of data. Starts with a free trial or $25 for 10,000 sessions, going up to $319 and more for 500,000+ sessions.
It is one of the tools of heatmaps that is user-friendly for US UX professionals. It offers the heatmaps of where users clicked the most (on CTAs), how far they had scrolled (like drop-offs above the fold), or the movement of their cursors. It comes with four price plans, from a free first trial to its first session offered at $49.
An easy-to-use tool for US small businesses, offering click heatmaps to see where users engage and scroll analysis through Screenshots. Also includes A/B testing and reports that break down click patterns. Great for non-technical teams to set up quickly. Free trial available, with plans starting at $29 for 30,000 pageviews, up to $599 for Enterprise.
A real-time tool for US e-commerce businesses, especially for pages with dynamic content like price changes. It offers heatmaps that adjust to show personalised user interactions and live-updating maps that show visitor locations. It also works with pop-up surveys and live chat, helping boost conversions quickly. Free trial available, with plans starting at $32 for the Starter plan, up to $839+ for Enterprise.
A free tool from Microsoft that’s perfect for US startups on a budget. It gives heatmaps that show where users click (including frustrating taps), how far they scroll, and where they get angry (by clicking rapidly). It also detects dead clicks (when users try to click but nothing happens). Includes unlimited session replays and AI-generated summaries. Trusted for privacy compliance, including CCPA. Free forever.
Conclusion
In short, heatmaps show how people use your website by highlighting where they click, scroll, and focus using colours; red shows areas people really engage with, and blue shows parts they ignore. Tools like Hotjar, Crazy Egg, and free Microsoft Clarity help improve call-to-action buttons, website layout, and mobile experience, which can increase conversions by more than 18% in real examples. Use these along with analytics and AI to make smart design changes and avoid mistakes like relying too much on small data or colour alone. Focus on pages that get a lot of traffic, test changes step by step, and see your user engagement grow.
FAQs
Q1: Are website heatmaps good for SEO?
Ans: Yes, website heatmaps are good for SEO, as they look at how users interact with a website, beyond just rankings and traffic.
Q2: Do heatmaps slow down websites?
Ans: No, heatmaps do not slow down websites, as they use lightweight scripts that won’t affect the working of a website.
Q3: Are heatmaps accurate?
Ans: Yes, heatmaps are mostly accurate to optimise your website as per the user’s intent.
Q4: Are Website Heatmaps GDPR & Privacy Compliant?
Ans: Yes, Website heatmaps are generally GDPR and privacy compliant, as they require consent for using the data, updating privacy policies, and installing tools with in-built compliant features.
Q5: How do heatmaps support semantic SEO optimization?
Ans: Heatmaps support SEO optimization by understanding the user behaviour and analysing the web page that helps to bridge the gap between user intent and content structure.
Q6: Can heatmaps help with E-E-A-T improvements?
Ans: Yes, heatmaps are perfect for E-E-A-T (Experience, Expertise, Authoritativeness, Trustworthiness) improvements as it understands the user behaviour to improve UX and build trust.
Q7: How do mobile heatmaps differ from desktop heatmaps?
Ans: Mobile heatmaps differ from desktop heatmaps due to their size. It works to analyse the taps/swipes for mobile apps, and clicks/hovers for the webpage.
Q8: Do heatmaps track individual users or aggregated behaviour?
Ans: Heatmaps focus on the overall user behaviour and do not analyse individually.
Q9: Are heatmaps affected by ad blockers or browser settings?
Ans: Yes, heatmaps can be impacted by ad blockers and browser settings. Most heatmap tools use third-party JavaScript scripts to track how users interact with a website, but security software, privacy tools, and browser settings can stop these scripts from working.
Q10: Is a website heatmap real user data or estimated data?
Ans: Heatmaps solely focus on the real user data and are not based on estimates.
Share This Article
About the Author: Akiko Sato
Related Articles
 June 8th, 2026 | 12 minutes read
Imagine you are running a coffee shop in Chicago. You know how to brew the best coffee in your neighborhood,
- June 1st, 2026 | 11 minutes read
TL, DR; People are now using AI tools like ChatGPT, Gemini, and Google AI to get direct answers online. ChatGPT
 May 25th, 2026 | 8 minutes read
List of Top 10 Digital Marketing Agencies in USA 1. DigitalGuider 2. WebFX 3. Disruptive Advertising 4. Ignite Visibility 5.
- May 21st, 2026 | 11 minutes read
Top 11 Best SEO Companies in Austin, Texas DigitalGuider Coalition Technologies WebFX Funnel Boost Media Thrive Agency Bird Marketing Motoza